
Understanding the Commitment of Traders (COT) Report
How to leverage institutional positioning data to decode true market sentiment and identify major macro reversals.
What is the COT Report?
The Commitment of Traders (COT) report is a weekly market report published every Friday at 3:30 PM EST by the Commodity Futures Trading Commission (CFTC). It breaks down the total aggregate holdings (long and short positions) of different participant categories in the US futures markets as of the preceding Tuesday's close.
While originally designed for agricultural commodities, it heavily covers financial futures—including major currencies. The legacy report divides market participants into three primary categories:
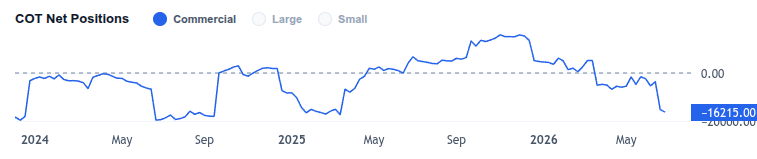
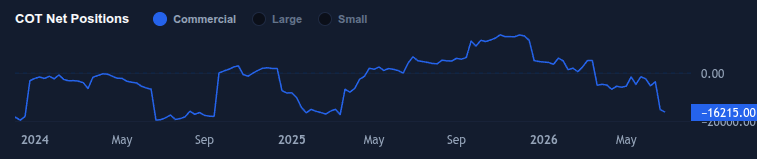
*Dashboard Note: As can be seen, Commercial Hedger sentiment is tracked using the Blue Line in our dashboard.*

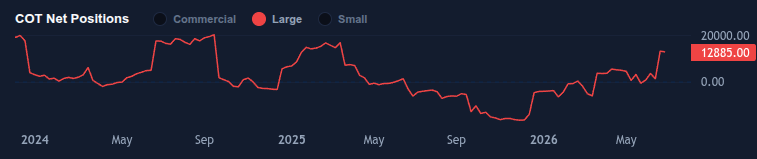
*Dashboard Note: As can be seen, the Large Speculator sentiment is tracked via the Red Line in our dashboard.*
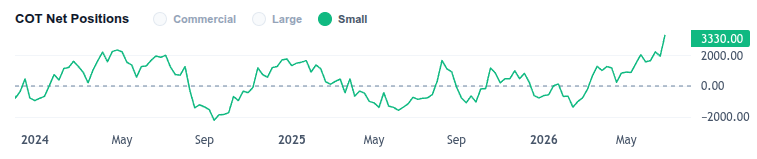
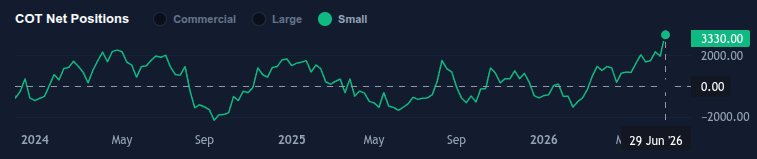
*Dashboard Note: As can be seen, the Small Speculator sentiment is tracked via the Green Line in our dashboard.*
Why Use COT for Forex Sentiment Analysis?
The foreign exchange market is decentralized and over-the-counter (OTC). Unlike a stock exchange, there is no single centralized clearinghouse tracking the volume or order flow of every global transaction. This makes finding true volume data nearly impossible.
The COT report serves as a proxy for the analysis of the broader spot forex market. Because the spot market and the futures market are tightly bound together by arbitrage, tracking the shifts in positioning of multi-billion dollar hedge funds on the Chicago Mercantile Exchange (CME) lets us spot institutional capital flows before they map onto your technical charts.
Decoding COT Net Positions and Indexes
To make raw futures contracts data actionable, our engine transforms tracking numbers into two highly distinct visual analytics:
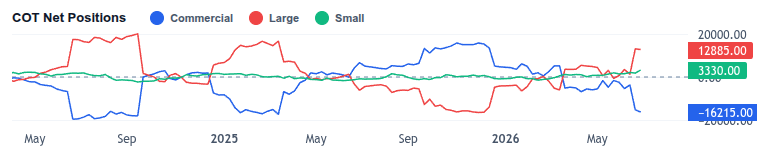
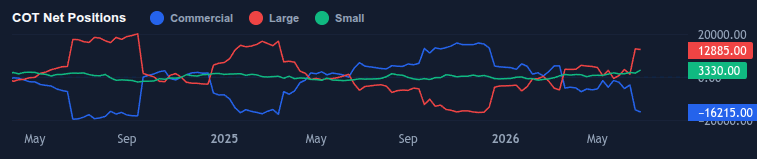
1. COT Net Positioning
Calculated by subtracting total short contracts from total long contracts. A positive value indicates net bullish sentiment, while a negative value shows a bearish sentiment bias. Watching this cross the zero-bound threshold highlights major directional momentum shifts.
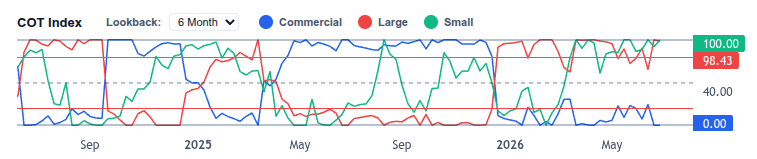
2. The COT Index (0% - 100%)
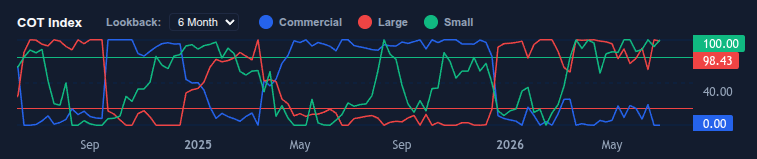
Normalizes raw positioning data by looking at current contract positions relative to look back period's maximum and minimum values. Common look back configurations vary based on trading style, with standard horizons typically set to 6 months, 1 year, 2 years, or even 3 years. An index near 100% means speculators are at maximum historical bullishness within that window (market overbought), while an index near 0% means they are at maximum historical bearishness (market oversold).
The Headache of Manual Cross-Pair Analysis
While raw COT data is incredibly powerful, utilizing it for non-dollar cross pairs presents a massive operational roadblock. The CFTC only tracks futures contracts for individual, isolated currencies (e.g., Euro futures, British Pound futures, Japanese Yen futures) against the US dollar. However, forex traders trade currency pairs (e.g., EUR/GBP, AUD/JPY).
To accurately evaluate a cross pair like EUR/JPY manually, you are forced to:
Seamless Analysis with Automated Cross-Pair Charts
Our application eliminates this entire problem. When you change tickers on your primary live dashboard, our system instantly isolates both halves of the active currency pair, parses the corresponding institutional futures files, and displays them as a single, fully cross-analyzed workspace component.
Single Unified Cross-Curve
Instead of forcing you to balance and compare two individual currency charts side-by-side, our platform merges the underlying data instantly. You see a single consolidated net positioning or index curve directly reflecting the true structural sentiment of the cross-analyzed pair.
Time-Locked Synergy
The sentiment tracking indices are perfectly locked with your candlestick chart parameters. Use your crosshair mouse tools to trace directly downward from technical trend line breaks to check if smart money accumulation matches your setup.
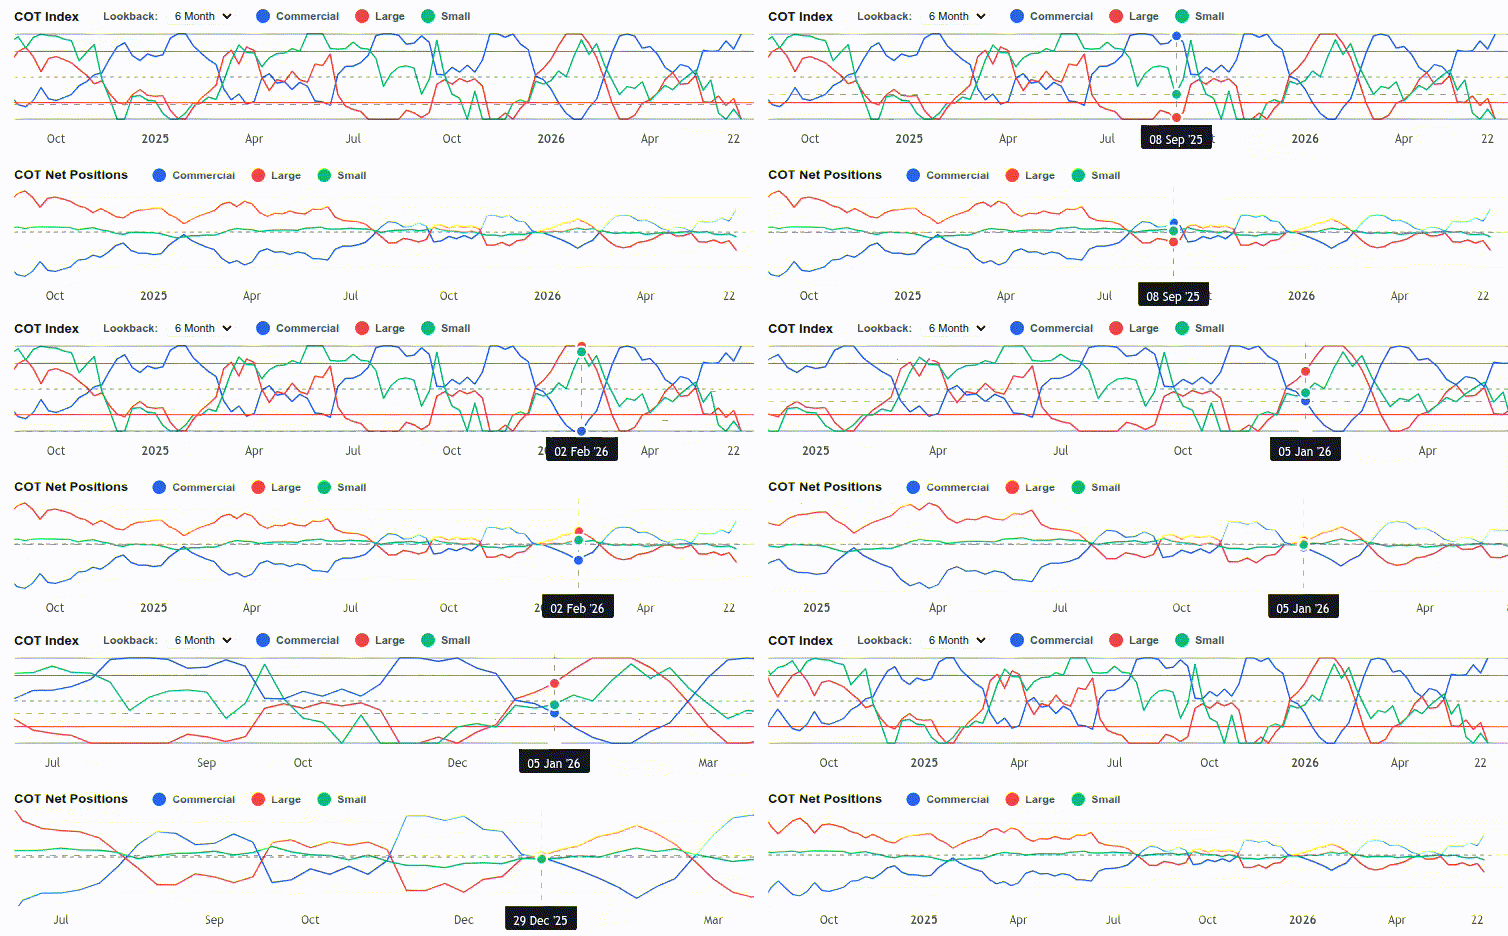
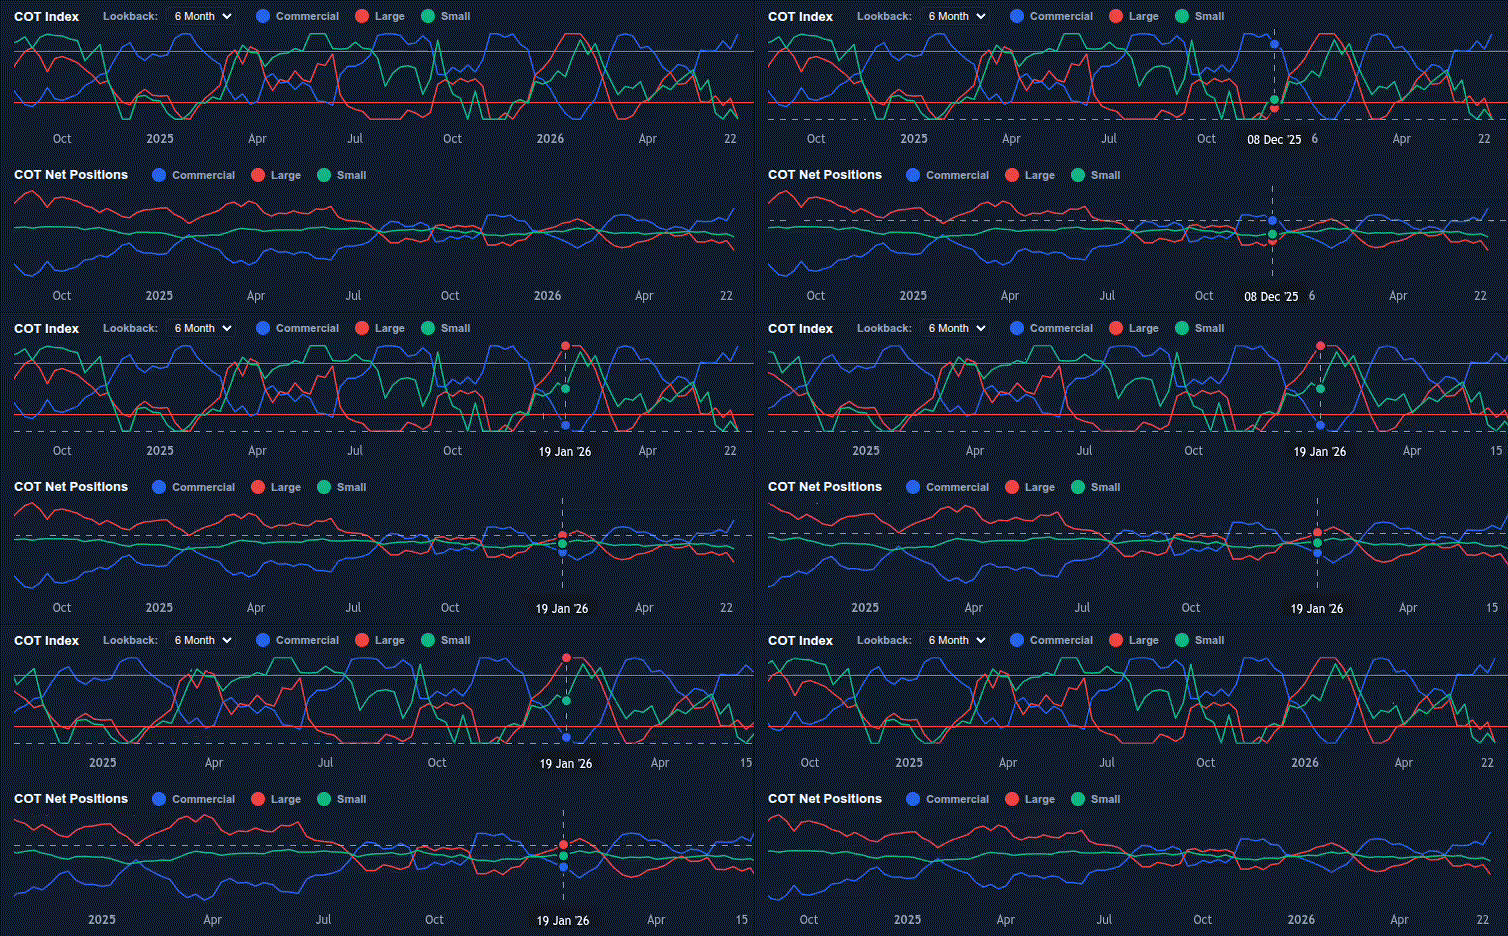
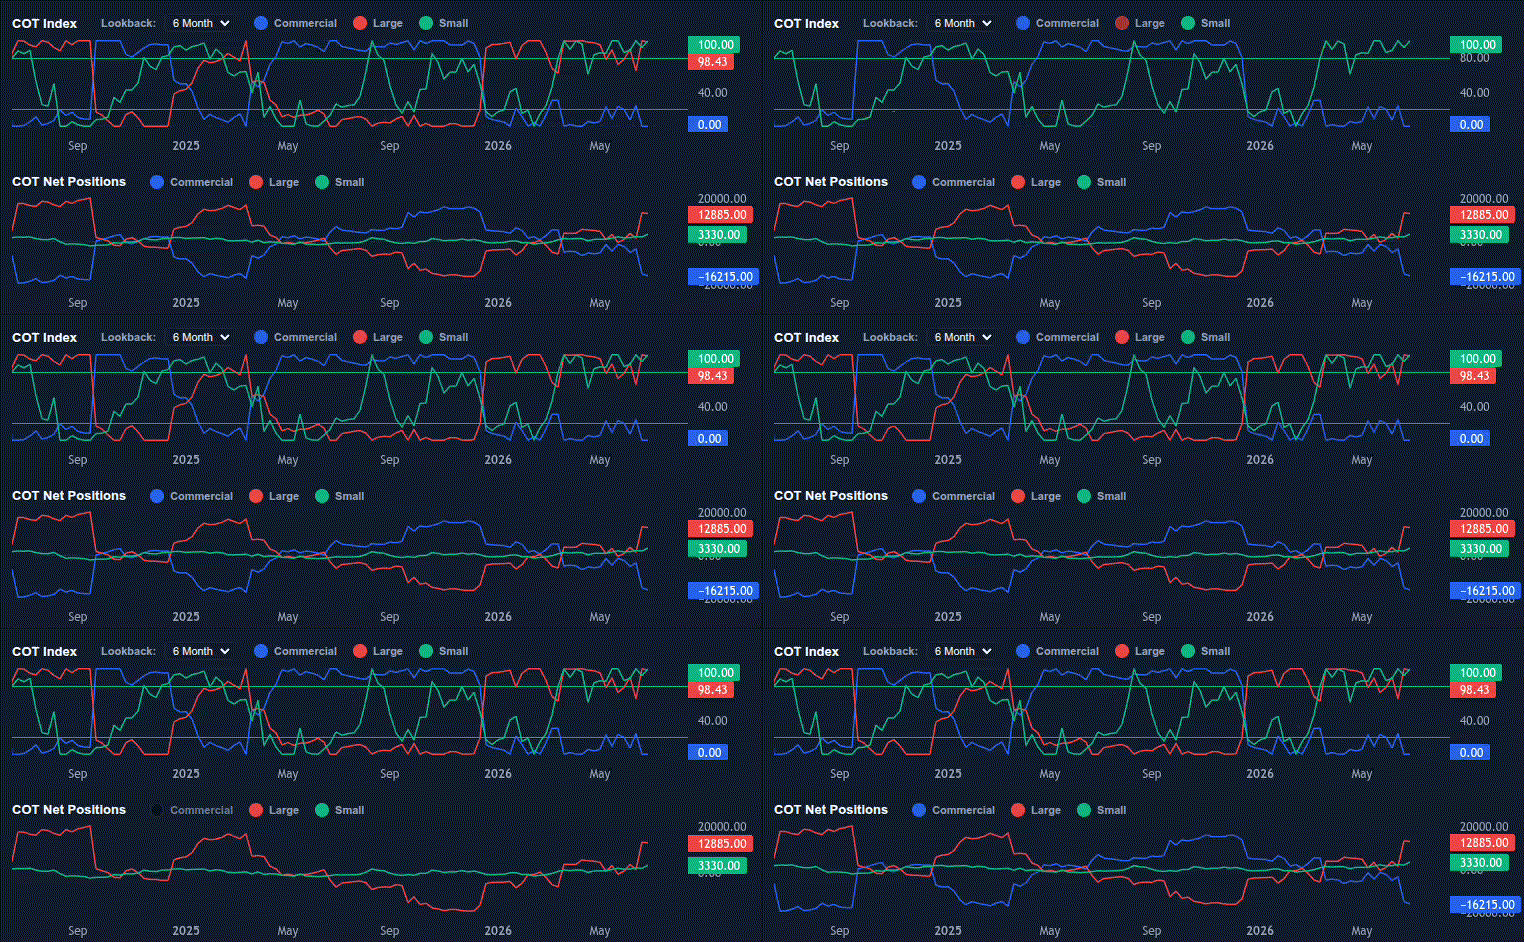
Figure: Dynamic cross-pair workspace displaying automated structural synthesis. Note how individual data points for the British Pound (GBP) and New Zealand Dollar (NZD) are automatically normalized into a clean, single set of composite metrics for the GBPNZD cross pair.
COT Position FilteringWorkspace Control
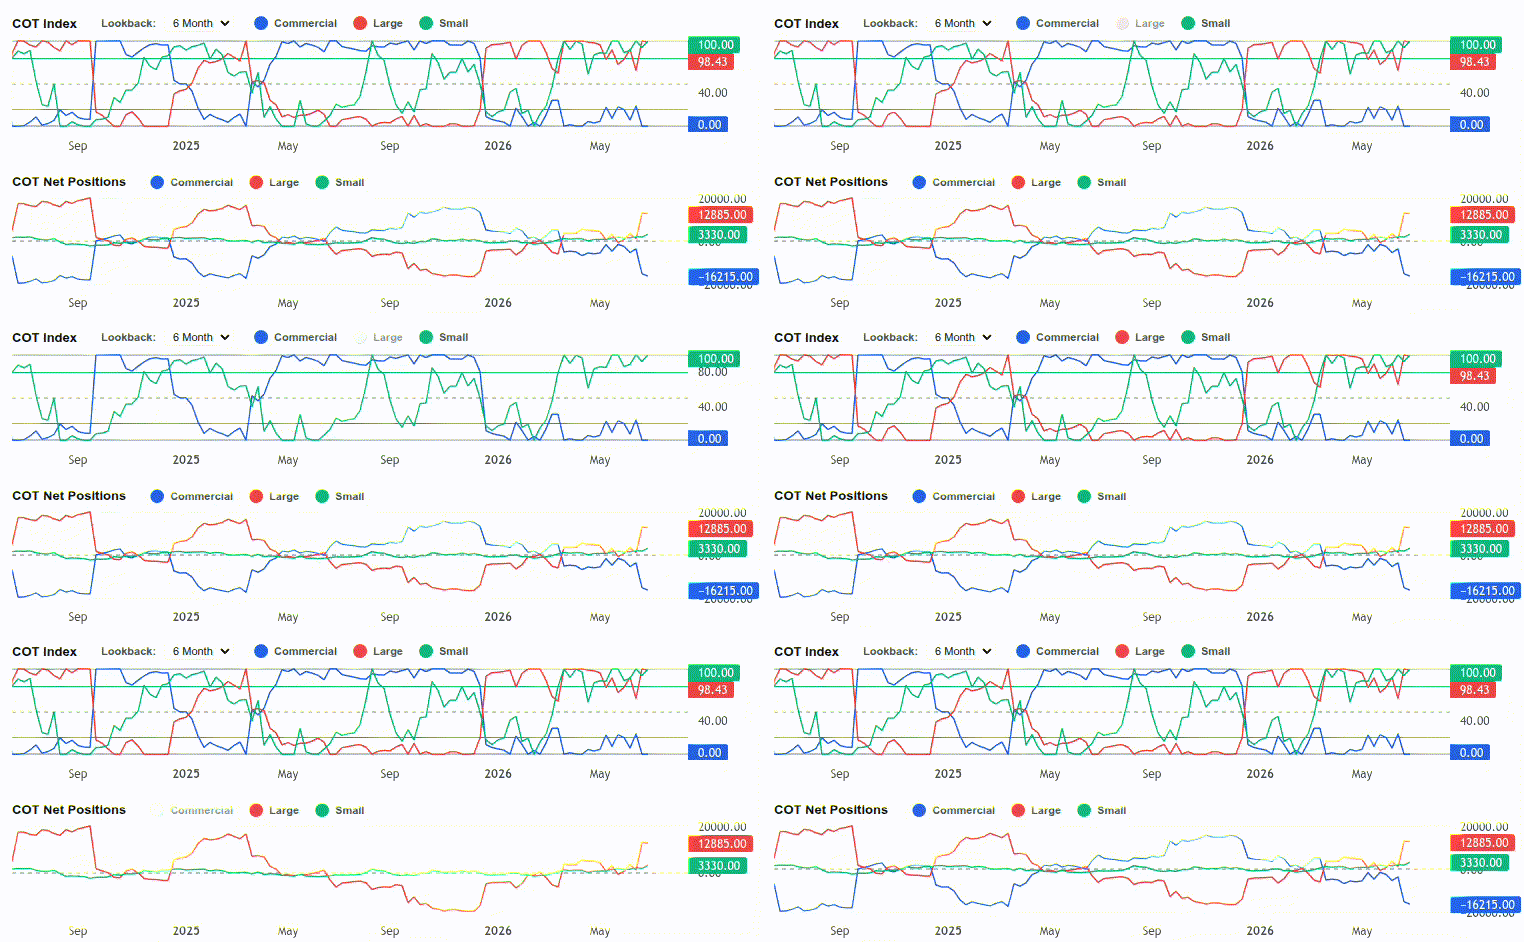
Isolating specific participants allows you to filter out noise and focus entirely on individual market groups. By default, the interface aggregates multiple layers of data. Using the tracking checkboxes on the control panel, you can selectively toggle individual lines off or on. This lets you drill deep into specific metrics like Commercial net hedges or Large Speculator positioning to easily trace divergences without overlapping indicators causing visual confusion.
Strategic Frameworks: Two Schools of Thought
When analyzing data from the COT report, market participants are generally split into two distinct schools of thought depending on their primary style of execution. We highly recommend doing further online research into specialized COT indicators, custom historical formulas, and backtested systems to find the variant that maps best onto your edge.
School 1: The Commercial Hedger Reversal Strategy
This counter-trend framework acts on the perspective that Commercial traders are the ultimate "smart money" because they operate inside the physical industries. Proponents look for market extremes to position themselves early for massive structural macroeconomic pivot points.
School 2: The Large Speculator Momentum Strategy
This trend-following framework recognizes that hedge funds and institutional asset allocations control the vast pools of speculative liquidity that propel prolonged directional movements. Proponents ride these waves of momentum until clear structural shifts occur.