
Understanding Historical Seasonality in Forex
How to leverage recurring multi-year calendar tendencies to identify high-probability macro turning points.
What is Forex Seasonality?
Just as retail stores experience predictable surges during the winter holidays, global financial markets follow distinct calendar-driven patterns. In the foreign exchange market, seasonality refers to the tendency of a currency pair to repeat specific bullish or bearish behaviors during certain times of the year.
These repetitive cycles span across years and are driven by massive, predictable real-world events:
Why Analyze Seasonality? (The Technical Edge)
Seasonality is not a magic crystal ball that predicts the exact day or hour a price will move. Instead, it serves as a map of the market's internal layout. Layering it over your current charting strategies gives you a significant unfair advantage:
Anticipating Turning Points
If your technical analysis shows an asset is reaching overbought resistance exactly when its cycle signals a common time for an annual peak, you have gained more confluence in your analysis for a potential market turnaround.
Evaluating Trend Health
Are you trying to short a market that is pushing downward during a multi-week window that historically has a 80% bullish win rate? Seasonality acts as a safety filter, highlighting whether you are swimming safely with the current tide or trading straight into an aggressive cyclical wall.

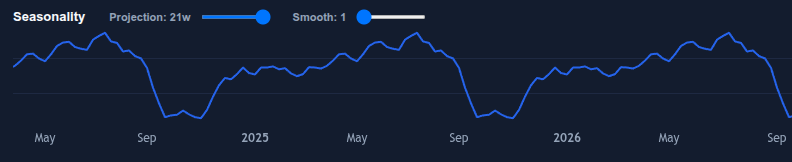
For Example: This seasonality chart model highlight a major recurring yearly selling opportunity at the end of summer due to seasonal liquidity exhaustion, followed by a major structural buying opportunity heading into the end of October as institutional year-end allocation positioning begins.
Navigating the Seasonality Analyzer Workspace
The seasonality chart directly beneath the main price chart runs an aggregated, multi-year historical tracking algorithm. Rather than guessing, you can adjust two precise custom parameters to optimize your view:
Seasonal Projection Slider Control
This parameter lets you extend the historical seasonal pattern into the future to create a forward forecast. Pushing the slider outward shows you what the market typically does in the coming weeks, helping you forecast future price changes and easily see where you currently are in the seasonal cycle.


The Smoothness FilterSlider Control
Historical data can sometimes contain erratic data anomalies from highly volatile single-day market news. Increasing the smoothness filter acts as a low-pass data modifier, shaving off erratic spikes to reveal the true underlying cyclical trend. Or, you may find that the smaller peaks and valleys line up closely with common monthly highs and lows.


X-Axis Date Alignment
The calendar timeline running along the bottom of the seasonality panel is perfectly locked in chronological sync with your upper technical chart. This lets you align vertical cursor crosshairs directly from a current market peak straight down to check its historical track symmetry.
Step-by-Step Routine for Analyzing a Currency Pair
To cleanly integrate seasonality analysis into your daily setup routine, follow this easy three-step workflow: